
In mid 2020 I was asked to be on a the Day Two Cloud Podcast to talk about Monitoring. I had a lot of fun recording it – if you like this blog post, give it a listen. One moment in our conversation that stood out to me was when I mentioned using Prometheus for monitoring my home network when I was troubleshooting performance problems. (It turned out to be a damaged underground ethernet cable, and my Prometheus data was critical in tracking it down.) The hosts were a little suprised because they had thought of Prometheus as a tool for managing large-scale infrastructure. But, it’s incredibly straightforward to use in the small as well, even running well on tiny hosts like a Raspberry Pi.
Our family recently moved to a home which actually has enough sun exposure to be able to get solar, which we did as soon as possible. Especially given the increase in power outages as the weather and fire seasons get more extreme, we opted for a battery backup system. We chose a 16 kWh system from Sonnen.
The Sonnen includes a nice dashboard which shows the real time sun production, home consumption, and how much power you are drawing from or pushing back to the grid. I immediately had questions that only a time series graph could answer. “Why is the battery at 40%? Did we use a bunch of power? When? Did it charge yesterday? How well did we produce when it was cloudy?”
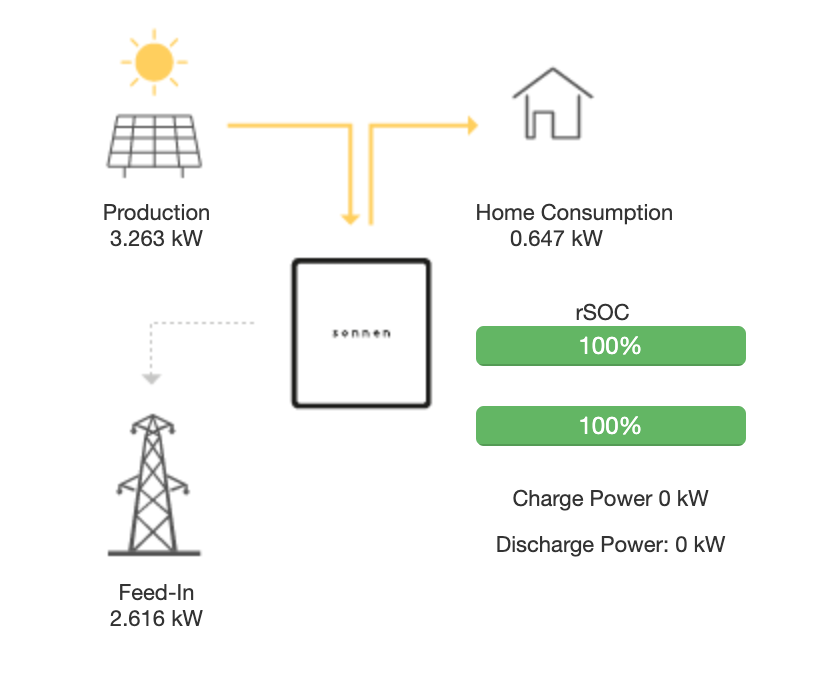
It turns out that the Sonnen’s dashboard is powered by a HTTP/JSON API. I couldn’t find official documentation, but that did not turn out to be a blocker.
Enter Prometheus
For the uninitiated, Prometheus is an open source monitoring tool. It’s primarily based around polling for data from “exporters”, which are other microservices (or endpoints embedded in other services) which publish metrics. It then stores those in a time series database, and has an API for querying them. There are also components for service discovery, alerting, and push metrics to support short-lived processes. It’s made up of microservices which communicate over the network, so it’s a perfect use case for Docker.
While it would be an interesting future exercise to run this on Kubernetes (or microk8s or k3s) for now I’m using docker-compose. Specifically dockprom has been my go to for the last few times I have spun up a hobby prometheus.
All it takes to get a basic prometheus setup going is:
$ git clone https://github.com/stefanprodan/dockprom
$ cd dockprom

$ ADMIN_USER=myuser ADMIN_PASSWORD=mypass docker-compose up -d
If you want to do something you plan to keep around for a while, it’s probably a good idea to fork the repo, so you can keep your personal changes in a branch but still pull in from the original repo if you want to get any updates.
This architecture diagram shows what you get out of the box with dockprom, as well as what needs to be added to support querying the Sonnen device. It includes 2 exporters – the NodeExporter, which exposes metrics about the physical machine, and cAdvisor, which exposes metrics about all the running containers. Prometheus also scrapes metrics about itself, and gathers those. When you start it up, there are predefined dashboards in Grafana conveniently tracking all of those.

So to gather data from the sonnen, we need a sonnen “exporter” – something that listens to HTTP, and exposes the prometheus exporter format.
Sonnen Exporter
Fortunately, I was able to find a premade exporter, sonnen-exporter. Unfortunately, it was in Rust, which is not inherently a problem, except I don’t know Rust yet. However, it seemed like a good starting point instead of DIY, so I gave it a shot.
These days when I’m building code in a language, especially not one that’s going to be a daily driver, I skip the “install the toolchain” step and jump straight to Docker. In this case, there’s a nice official image.
Ultimately what I want is a slim container with a compiled binary in it, but for tinkering, it’s usually a good idea to start with getting a shell going.
I cloned Ben’s Sonnen repo, then launched a shell in a container based on the rust image.
$ docker run --rm -it -v $(pwd):/build rust:1.49
root@3c809e61a213:/# cd /build/sonnen-exporter
root@3c809e61a213:/build/sonnen-exporter# cargo build --release
... lots of action
    Finished release [optimized] target(s) in 49.28s
root@3c809e61a213:/build/sonnen-exporter# find . -name sonnen-exporter
./target/release/sonnen-exporter
Sweet! That should work, then. Now to make it into a Dockerfile so it can be used:
FROM rust:1.49 as builder
COPY ./sonnen-exporter /sonnen-exporter
RUN cd /sonnen-exporter && cargo build --release

FROM debian:buster-slim
RUN apt-get update \
		&& apt-get install -y ca-certificates tzdata \
	&& rm -rf /var/lib/apt/lists/*
EXPOSE 9422
COPY --from=builder /sonnen-exporter/target/release/sonnen-exporter /usr/local/bin/sonnen-exporter
CMD ["/usr/local/bin/sonnen-exporter", "/etc/sonnen-exporter/config.toml"]
This is pretty straightforward, using the builder pattern. It’s using that rust image to actually compile a static binary, and then setting up a slim debian container, installing the SSL chain certificates (since this has HTTPS support) and cleaning up the apt files, exposing the port this app runs on by default, and then copying in the binary. By default it will run the command looking for it’s config file in /etc/sonnen-exporter/.
It just needs to be built now, and we’re ready to go:
$ docker build -t sonnen-exporter .
It did not turn out to be quite that easy – it looks like there were some changes to the Sonnen’s API since this code was written, so I had to make some tweaks. The inverter JSON payload seems like it’s changed a ton, so I just commented out that fetch. I don’t need detailed inverter stats yet. One other variable name also changed. Kudos to rust for very readable error messages, it was really easy to figure out what was going on.
@@ -16,7 +16,7 @@ impl<'a> SonnenReader<'a> {
             status: SonnenStatus::new(),
         };
         reader.main_status()?;
-        reader.inverter()?;
+        //reader.inverter()?;
         reader.power_meter()?;
         reader.status.online = true;
         Ok(reader.status)
@@ -66,7 +66,7 @@ impl<'a> SonnenReader<'a> {
     fn power_meter(&mut self) -> Result<(), Box<Error>> {
         let json: Value = self.fetch_json("/api/powermeter")?;
         let json_prod = json["4_1"].as_object().unwrap();
-        let json_cons = json["4_2"].as_object().unwrap();
+        let json_cons = json["5_1"].as_object().unwrap();
         let mut current_prod = [0.0; 3];
         let mut current_cons = [0.0; 3];
         let mut volts_prod = [0.0; 3];
Long term I may build a new exporter in a language I’m more comfortable in – or use this as a reason to finally learn rust – but this works for now!
Hooking up the Exporter
Getting the container image build for the dashboard is important, but it still needs to be running, and prometheus needs to query it.
Running it is easy, just add a new section to the docker-compose.yaml file:
  sonnen:
    image: sonnen-exporter:latest
    container_name: sonnenexporter
    expose:
      - 9422
    networks:
      - monitor-net
    volumes:
      - ./sonnen-exporter:/etc/sonnen-exporter
    restart: unless-stopped
    labels:
      org.label-schema.group: "monitoring"
Then prometheus needs to know to scrape this new exporter, in prometheus/prometheus.yml:
  - job_name: 'sonnenexporter'
    scrape_interval: 5s
    static_configs:
      - targets: ['sonnenexporter:9422']
And that’s it! After running docker-compose up -d, the exporter is running, and prometheus will start scraping the data.
Building The Dashboard
Grafana makes it very easy to build a nice dashboard.
This is what happens when graphing the following variables:
sonnen_consumption_wattsas “Home Consumption”sonnen_discharge_wattsas “Discharge”sonnen_grid_feed_in_wattsas “To Grid”sonnen_production_wattsas “Production”sonnen_state_of_charge_percent(on the right Y axis)
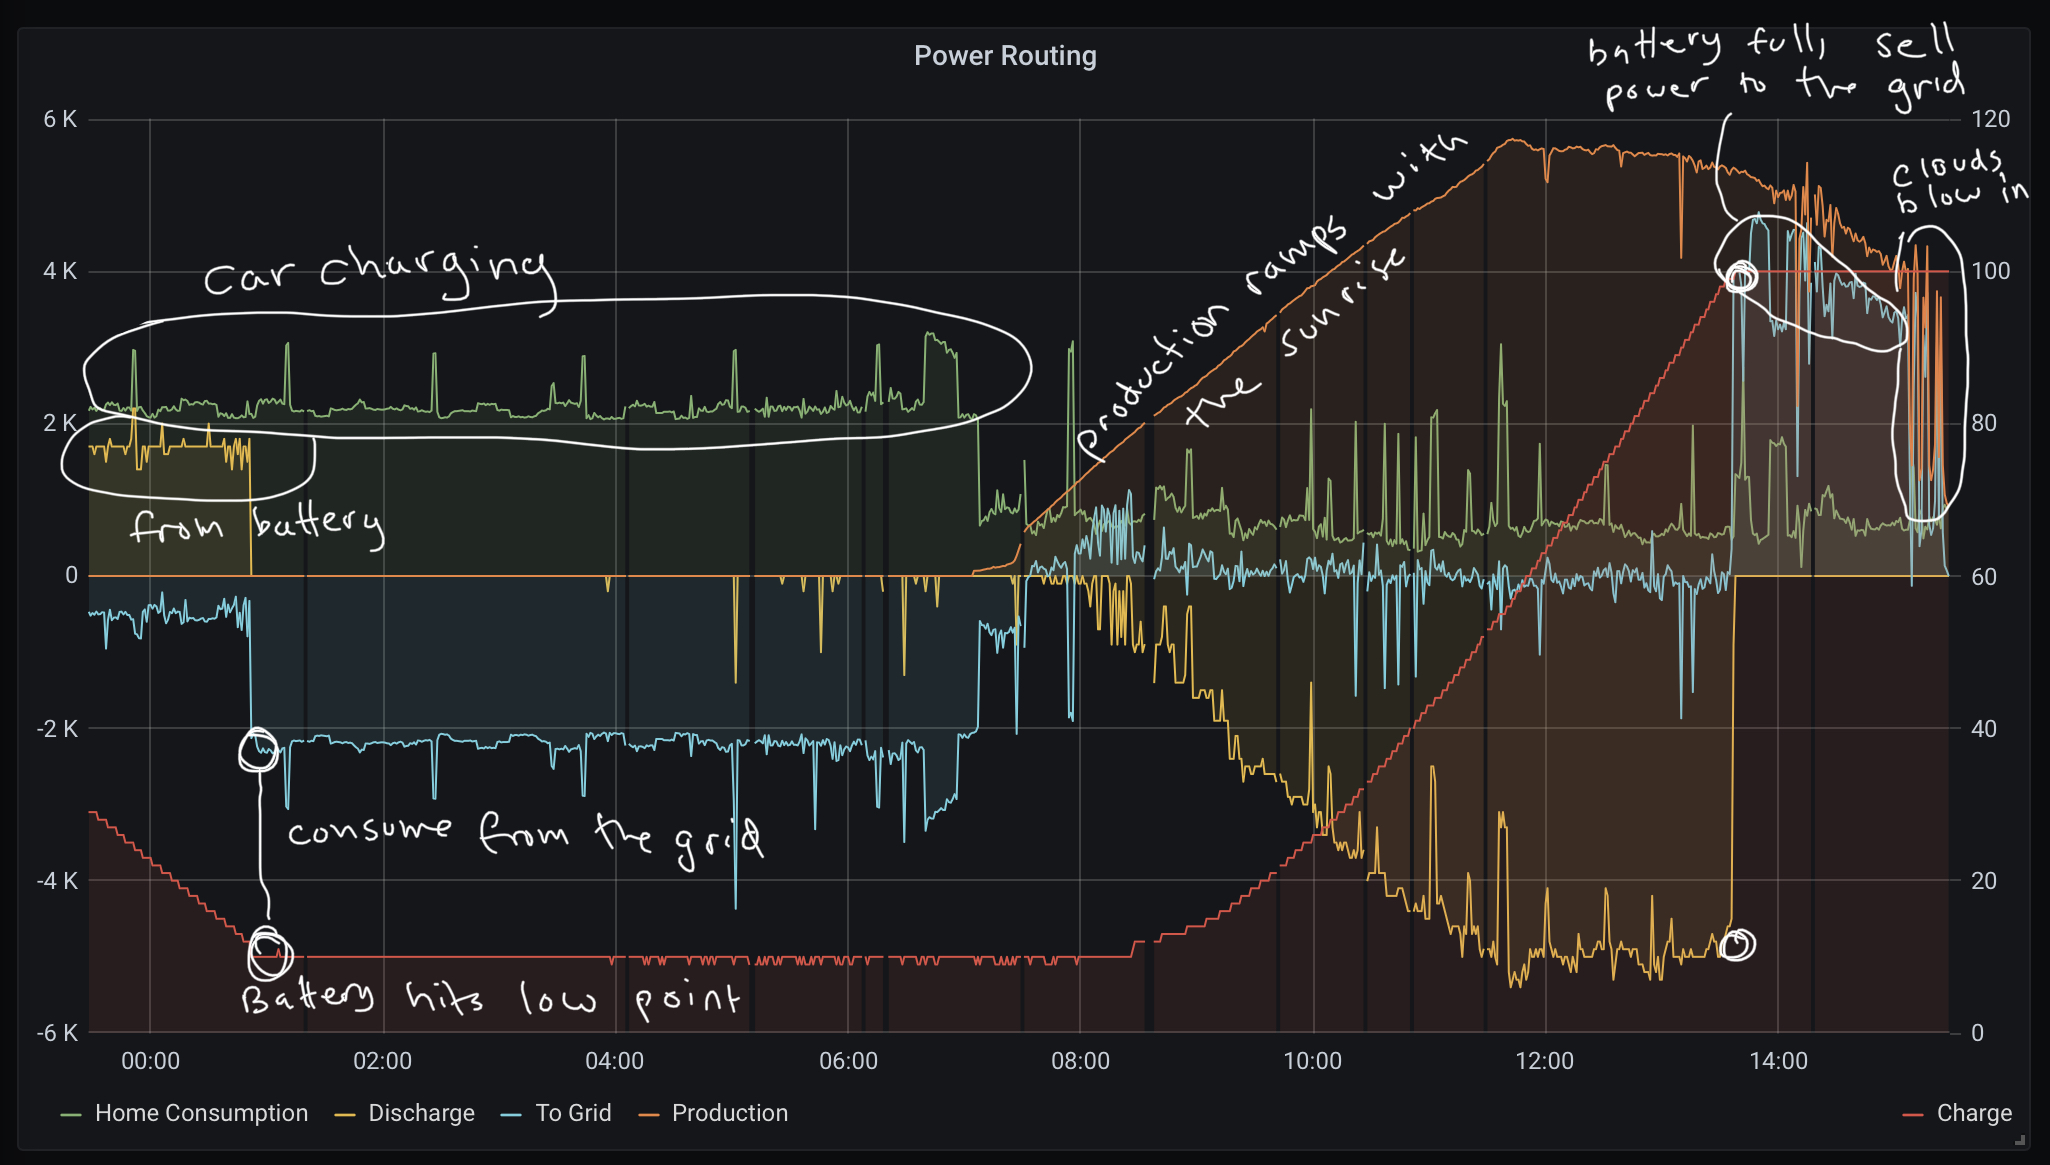
This paints a pretty interesting picture (well, interesting to me at least) of the power flow over the majority of the last day. We have a plug in electric hybrid that we plugged in late in the day. It charging causes the house to draw just over 2 kW, which it’s getting most of from the battery. When the battery hits the low power reserve level (10%), we switch to full grid consumption.
Around 7am the car stops charging, and the sun is up. Just before 8 there’s enough solar production to cover the needs of the house, so energy starts flowing into the Sonnen. The rate of charge steadily increases until about 11am, and the battery is fully charged around 1:30pm. Between then and around 3, the battery is charged, and the solar system is now producing excess power, so it supplies about 4 kW back to the grid. Around 4:30, some heavy clouds came blowing in, and you can see the impact on power production and how much was going to the grid.
The other thing I was curious about was how close we are to being fully self-sufficient – how much are we ahead of what we take from, vs provide to, the grid?
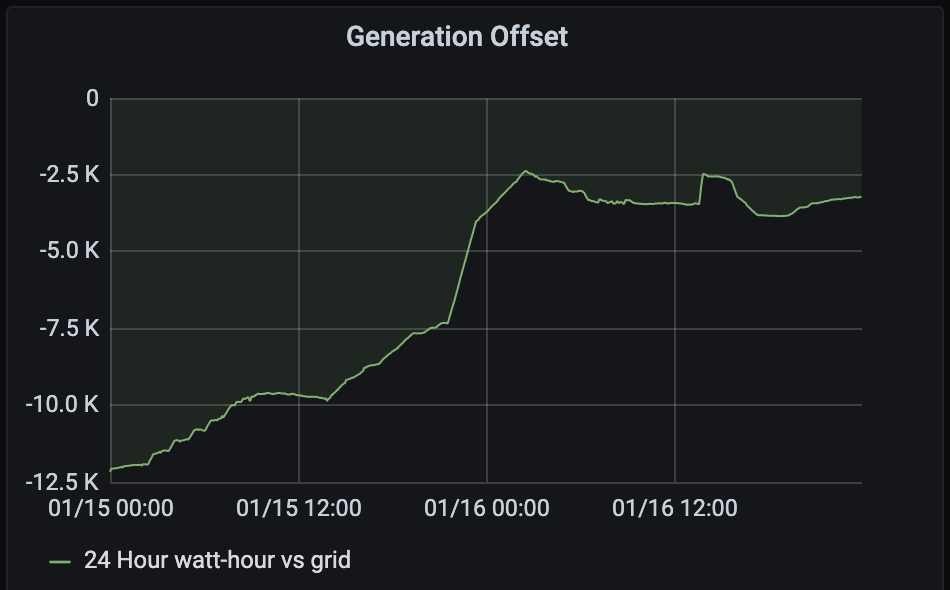
This is not a perfect method, but it’s a decent starting point. This is calculating
avg_over_time(sonnen_grid_feed_in_watts[24h])*24
To translate from PromQL to English, it’s saying “take the average feed value in watts over the last 24 hours, then multiply that by 24”. This essentially should give a moving average of how many watt-hours ahead or behind of the grid things are for the prior 24 hours. So, if it’s zero, that means we’re at full parity – we have produced as much to the grid as we have consumed from it, on average. Anything below zero means that consumption is larger than production, and greater than zero means the opposite.
I wanted to confirm that this approach worked the way I expected. It seems reasonable – if you had watt measurements for every minute of an hour, you’d add them all up and divide by 60 to figure out the watt-hour. This is exactly the same calculation needed to calculate a mean.
For fun, and to test the intuition here a bit, I decided to use the Prometheus Query API to fetch all available data for the last hour, and then to also have PromQL calculate the average in the way I’m doing it for the chart.
This is ‘sketchy’ code from a Jupyter Lab notebook, but it did the trick.
# Fetch the data for the last hour
end = time.time()
start = end - 3600

# If you're using dockprom, there will be basic auth credentials on your prometheus port
response = requests.get(PROMETHEUS + '/api/v1/query_range',
                        auth=('...', '...'),
                        params={
                            'query': 'sonnen_grid_feed_in_watts',
                            'step': '15s',
                            'start': start,
                            'end': end
                        })
results = response.json()['data']['result'][0]['values']

""" Looks like a list of lists of [unix timestamp, data point]
[[1611033839.688, '-948'], [1611033854.688, '-884'], [1611033869.688, '-888'], [1611033884.688, '-964'], [1611033899.688, '-968'], [1611033914.688, '-944'], [1611033929.688, '-952'], [1611033944.688, '-1132'], [1611033959.688, '-932'], [1611033974.688, '-944'], [1611033989.688, '-908'],
"""

# Turn that into a data frame and fix up the types
df = pd.DataFrame(data=results, columns=['ts', 'value'])
df['timestamp'] = pd.to_datetime(df['ts'], unit='s', origin='unix')
df['value'] = df.value.astype(int)

# Calculate the mean of the hour of data
measured_mean = df['value'].mean()

# Returned -890.2406639004149

# Ok, now have Prometheus do the avg_over_time calculation used in the chart:
response = requests.get(PROMETHEUS + '/api/v1/query',
                        auth=('...', '...'),
                        params={
                            'query': 'avg_over_time(sonnen_grid_feed_in_watts[1h])'
                        })
results = response.json()['data']['result']
prom_avg = results[0]['value'][1]

# Returned -891.4269819193331
It seems that Prometheus is calculating basically the same value as I’d be doing if I was working with the data points directly. Using averages has an extra nice property of being pretty stable if there’s a data point or two missing. I tested this on different multi-hour windows and the results came back consistent. It’s not going to be precise, but it’s nice to have a running idea of how my power bills (or credits) are going to look.
And So
Hopefully this was a helpful glimpse at how much of a handy tool Prometheus can be to have in your toolbox. Especially when paired with docker, it’s really easy to have a powerful, configurable time series metrics/monitoring/alerting service up and running on your network.
It’s such a great design, because if you can write a simple HTTP service in any language to fetch what you want, you can get data flowing into Prometheus!
For serious things, there are obviously lots of other things beyond what was covered in this post you might want to set up – backing up the data, scaling out if needed, setting up alerts, etc – but for a lot of home network use cases, this kind of approach is good enough.