In most modern organizations, essential logs will be sent to an internal or hosted log management service. However, that may not yet be the case, or it may not be the case for 💯 of the logs.
Over the last few years, I’ve found a tool called GoAccess incredibly useful in a variety of the more edge case scenarios, or for environments where full scale log infrastructure wasn’t needed.
At it’s heart, GoAccess is a high speed HTTP log processing and analytics engine, with a few very handy additional features.
Use cases I’ve found it particularly useful for:
- As the website notes, with the terminal output mode, it’s very handy for realtime troubleshooting on a server. (“What is responsible for the traffic I’m observing?” )
- Out of the box, it supports many types of AWS specific logs, such as ELB and CloudFront. This can be helpful for seeing specific details of a single sampling point of your infrastructure. (e.g. calls from one backend service to another.)
- It has JSON output, which makes it very straightforward to extract structured information, for aggregating log data to time series metric systems or other dashboards.
Example: Processing Cloudwatch Logs
I was curious about what my blog traffic looked like, especially after the relaunch.
I do have Google Analytics turned on, but many people’s ad blockers also block the GA plugin; and most bots and crawlers won’t report in, either.
I made a simple Makefile with 2 targets in it.
The first fetches the logs from the s3 bucket, for the current month and previous month. The log pattern includes the datestamp, so this can be used for basic date range filtering.
fetch:
	aws s3 sync --exclude "*" --include "*2017-06*" --include "*2017-07*" s3://mylogbucket/ .
The report target runs GoAccess twice, once to see the entire report, and the second one adding a simple grep to filter the logs down to only cache misses. This can be a handy way to validate the behavior of the caching rules that are in place.
report:
	zcat cdn/*.gz | goaccess --log-format CLOUDFRONT --date-format CLOUDFRONT --time-format CLOUDFRONT -o ~/serialized.html
	zcat cdn/*.gz | grep '\sMiss\s' | goaccess --log-format CLOUDFRONT --date-format CLOUDFRONT --time-format CLOUDFRONT -o ~/serialized_misses.html
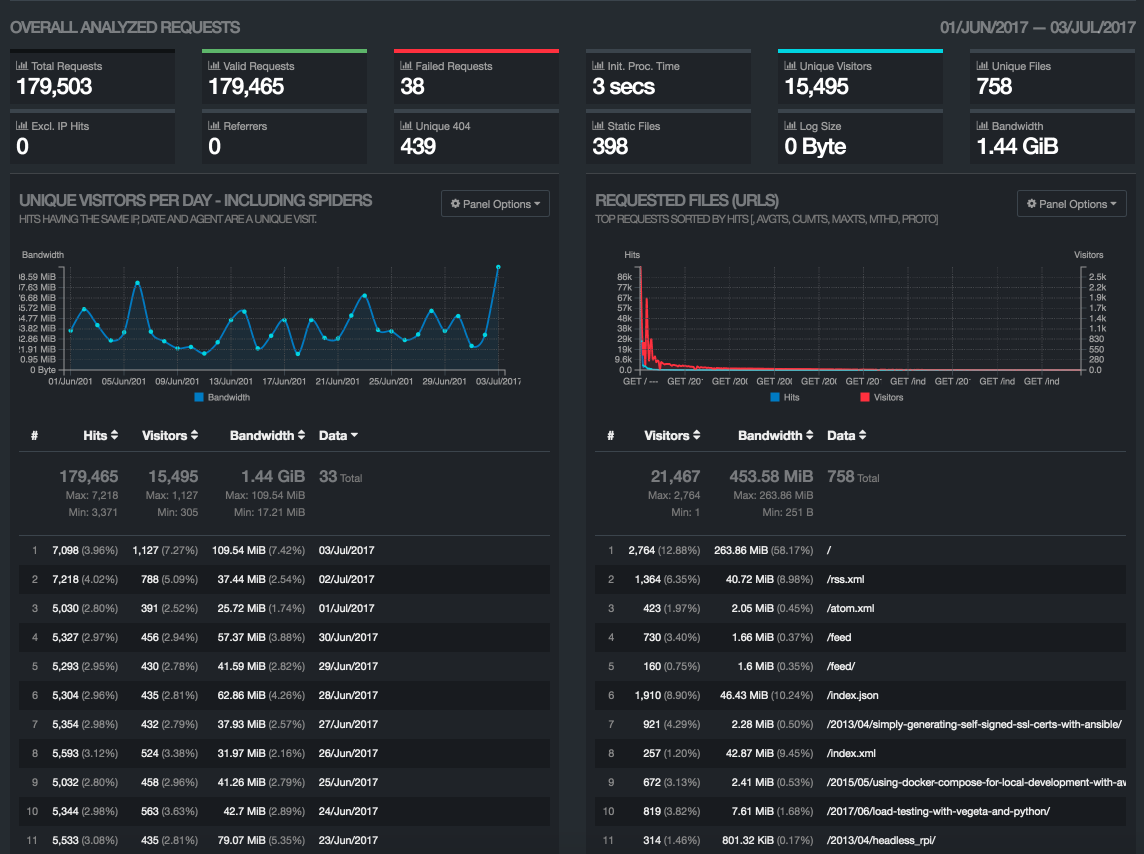
Running make report only takes 4 seconds and I get a quite nice static HTML page (which has lots of interactive capabilities and optional settings.)

Sure enough, it reports about 2x the traffic that shows up in Google Analytics. At my traffic levels, this is no big deal, but if my bandwidth bills were starting to become painful, it would be very useful to be able to see what exactly is being downloaded and by whom.
I really like how easy it is to filter down what goes into the report, as well. As discussed, it means being able to filter on cache status. Alternatively, if a particular bot user agent is being very agressive, it’s possible to generate a whole report showing only and exactly what that bot is doing.
Using JSON
Running goaccess with -o json gives a JSON representation of all the data. I’ve used this before when a customer had a large group of different virtual hosts on the same Cloudfront & ELB, and wanted accurate per-vhost hit and bandwidth information for internal rebilling.
Running with the json output results in all the data from the HTML display. Here’s what an example per-vhost record looks like:
"vhosts": [
        {
                "hits": 219575,
                "visitors": 6956,
                "percent": 49.77,
                "bytes": 24177209144,
                "avgts": 7777,
                "cumts": 1707745000,
                "maxts": 2831000,
                "data": "some.vhost.com"
        },
        ...
It’s easy then to, for example, fetch the logs every night from cloudwatch logs (in our case, with the excellent awslogs), extract the bytes/day/host, and store those back into a database.
And that’s it! A simple, well functioning tool that’s my first choice when I’m dealing with HTTP logs in the raw.
